Emalahleni is one of the municipalities that experienced population growth rates higher than their economic growth rates, which is not positive at all. This has negative implications from a GDP per capita and an infrastructure, service delivery, job creation point of view. The economy cannot keep up with the population growth and that will have a negative impact on infrastructure.
Emalahleni municipality contributes 45.9% of the economy in Nkangala District Municipality as per 2019 Provincial Municipal Profile Report by the Department of Economic Development & Tourism. Emalahleni is the biggest economy contributor in the Nkangala District and the second largest in the Province after the City of Mbombela. It is contributing 18% to the Provincial GDP as in 2018. The size of the economy of Emalahleni was estimated at R66 billion in 2018.
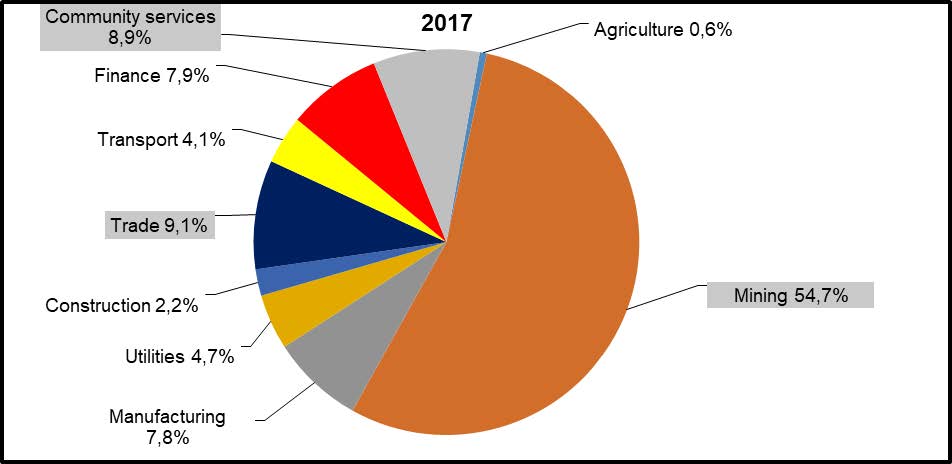
The strongest sectors are mining which contributes more than half to the Emalahleni economy almost 55% in 2017. Trade is the second largest industry in Emalahleni with a contribution of 9.1% followed by community services (8,9%) and finance (7.9%) respectively. Mining is the biggest sector of the economy even though it comes with negatives consequences on environment (pollution) and health (pollution causes diseases).
It is projected that the annual growth domestic product of Emalahleni will be less than 0.9% between 2018-2023. This is negative growth when we consider aspirations of the National Development Plan, Provincial Strategies and Emalahleni population growth.
Figure 12: Contribution by industries in Emalahleni, 2017 Source Source: IHS Markit

Tourism contribution
Tourism contributed 2.3 % of Emalahleni economy in 2017. Tourism should further be exploited to realize potential benefits of this sector. Emalahleni’s planned economic activities thus far include Mining and Metals Technology Park, resuscitation of township economies, support to SMMEs and Co-operatives, fly ash beneficiation, establishment of mining museum and convention centre.
These economic opportunities will ensure that strong and upcoming economic sectors are exploited to the fullest.
Table 7: Tourism contribution
Local Municipal Area | Total tourism spend (R-million) | Tourism spend as % of GDP (current prices) | ||
|---|---|---|---|---|
2011 | 2016 | 2011 | 2011 | |
Dr. JS Moroka | 52 450 | 50 738 | 84.4% | 81.4% |
Emalahleni | 31 527 | 40 721 | 26.3% | 27.1% |
Victor Khanye | 3 062 | 1 585 | 14.9% | 6.5% |
Steve Tshwete | 5 782 | 7 458 | 8.9% | 8.6% |
Emakhazeni | 2 209 | 2 573 | 21.4% | 17.6% |
Thembisile Hani | 68 022 | 73 411 | 89.9% | 88.7% |
Dr. JS Moroka | 52 450 | 50 738 | 84.4% | 81.4% |
